The Evolving CAS Exam: Shift in Question Types
If you have recently sat for an upper-level exam, you may have noticed some new question types. Questions are now posed with an increased emphasis on thorough understanding and evaluation. These changes are part of an ongoing CAS process to develop questions that allow candidates to demonstrate a deep understanding of syllabus material.
Educators often refer to a tool called Bloom’s Taxonomy to classify questions into six categories. (See Future Fellows, “What is Bloom’s Taxonomy,” December 2010.) The levels range from Level 1, broadly characterized as knowledge, to Level 6, characterized as evaluation. Higher levels within the taxonomy stress synthesis, comparison, and subtlety of understanding. Over time, CAS exams will incorporate higher-level questions within this metric. To help you prepare, we’ve provided some examples of changes within the taxonomy, as well as a recent CAS exam question that demonstrates the shift.

In each of these examples, the question covers a similar topic, but the question at the higher Bloom’s level may require combining multiple concepts, weighing multiple options, or evaluating whether a choice is appropriate. While the syllabus remains rather stable, the questions may encourage you to think more about how the subject matter is interrelated.
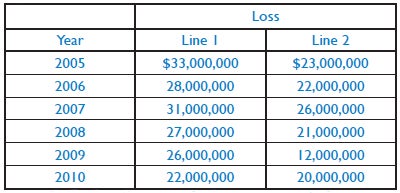
For a specific recent example, we look at Question 20 from Spring 2011 Exam 7: An actuary is modeling a cat-exposed loss portfolio covering two lines of business and has the following loss history.

- Fully describe and calculate two statistical measures that can be used to quantify the dependence between these lines of business based on the loss history above.
- Explain which of the two measures described in part a. above would better describe the dependence between these lines of business. Use the properties of these measures to support your answer. There is also available a scatter-plot that represents the relationship between these two lines of business for the entire industry for 2005 through 2010. For each company in the industry, a point represents a pair of loss ratios for a given year.
- Based on the scatter-plot above, identify a copula that would be appropriate to model the relationship between these two lines of business. Fully explain your answer.
- Discuss a possible effect on the various tail-based risk measures of not selecting a copula that properly models the relationship between these two lines of business.

This question incorporates many different elements from the exam syllabus. In addition to naming statistical measures, you are asked to comment on their applicability. This means that you need to remember the independence measures and understand when each one might be most useful. The question then goes further, asking you to provide a copula that would describe the correlation illustrated in the accompanying scatter plot and to discuss the effect of that choice.
This question brings together several concepts, from standard correlation measures to copula selection, and asks you to explain why your choices are valid and appropriate. Understanding the effect of your choice demonstrates that you grasp what features of a copula are relevant to this example.
More “traditional” exam questions might have asked you to identify several copula types, along with their assumptions about tail dependence. This question, on the contrary, asks you to make and defend a specific choice, informed by your knowledge of correlation and copulas.
CAS exams are always evolving, and higher-level questions are part of this process. The questions should provide a broader coverage of syllabus material by asking the candidate to synthesize ideas and techniques. While awareness of these question types should help you to prepare, your basic preparation process probably won’t change. The goal is still to understand and be able to apply the concepts and techniques presented in the syllabus. Be ready for a shift in question types, but don’t abandon your tried-and-true study habits.
